

For many novice investors, the term “Put/Call Ratio” (P/C Ratio) might be unfamiliar. We typically only hear it mentioned in financial media during periods of sustained market rallies or sharp declines. So, what does it signify when the P/C Ratio is particularly high or low? Does it unveil hidden trading opportunities? Let’s delve into the meaning of the P/C Ratio.
What is the Put/Call Ratio?
Literally translated, the P/C Ratio is the “value of puts divided by calls.” The concepts of ‘put’ and ‘call’ here are directly linked to the fundamentals of options trading: a ‘put’ represents a bearish outlook (a bet on a price decline), while a ‘call’ represents a bullish outlook (a bet on a price increase). Therefore, a higher ratio signifies that the volume of puts purchased exceeds the volume of calls purchased. Conversely, when the volume of puts is less than the volume of calls, the ratio will be lower.
Interpreting P/C Values
Before explaining the P/C Ratio, it’s crucial to understand market differences. In the Taiwanese market, this ratio is primarily analyzed by futures and options traders. This is because single-stock options are not widely traded in Taiwan, leading to insufficient trading volume (poor liquidity). For index options, the Taiwan Futures Exchange (TAIFEX) publishes this ratio daily after the market closes. However, in the vast U.S. stock market, the P/C Ratio can be observed for many individual stocks to gauge the prevailing sentiment of most investors towards a specific stock.
Having understood these market differences, how should we interpret P/C values? At a basic level, a P/C Ratio greater than 1 suggests a more pronounced bearish sentiment for the day, with more capital flowing into put options, betting on a market decline. However, does a higher volume of put buying guarantee a market downturn? Not necessarily. (As the Wall Street adage goes: “Bull markets are born on pessimism, grow on skepticism, mature on optimism, and die on euphoria.”) Conversely, if one were to simply go long when the ratio is > 1 and short when it’s < 1, would that lead to surefire profits? Also, no. Therefore, when interpreting any technical indicator or numerical value, we must avoid thinking in absolutes and instead understand their potential correlations and the broader context.
P/C Ratio and Open Interest
Beyond the P/C Ratio calculated from trading volume, another statistic we encounter is the Open Interest P/C Ratio. When observing the P/C values for individual U.S. stocks, this typically refers to the open interest P/C Ratio. To avoid confusion, we’ll specifically refer to it as the “Open Interest” P/C value. This is also the more closely watched figure in the Taiwanese market.
Imagine: what does a very low Open Interest P/C Ratio imply? (Open interest refers to contracts that have not yet been settled or closed). This has a different implication than the volume-based P/C Ratio. A declining Open Interest P/C Ratio suggests that bullish positions are increasing or bearish positions are being closed out (e.g., short covering). Conversely, a rising ratio indicates that bearish positions are accumulating or bullish positions are being liquidated (e.g., long liquidation/stop-losses). Can we then devise trading strategies by observing changes in this value?
Relationship Between P/C Values and the Overall Market Index
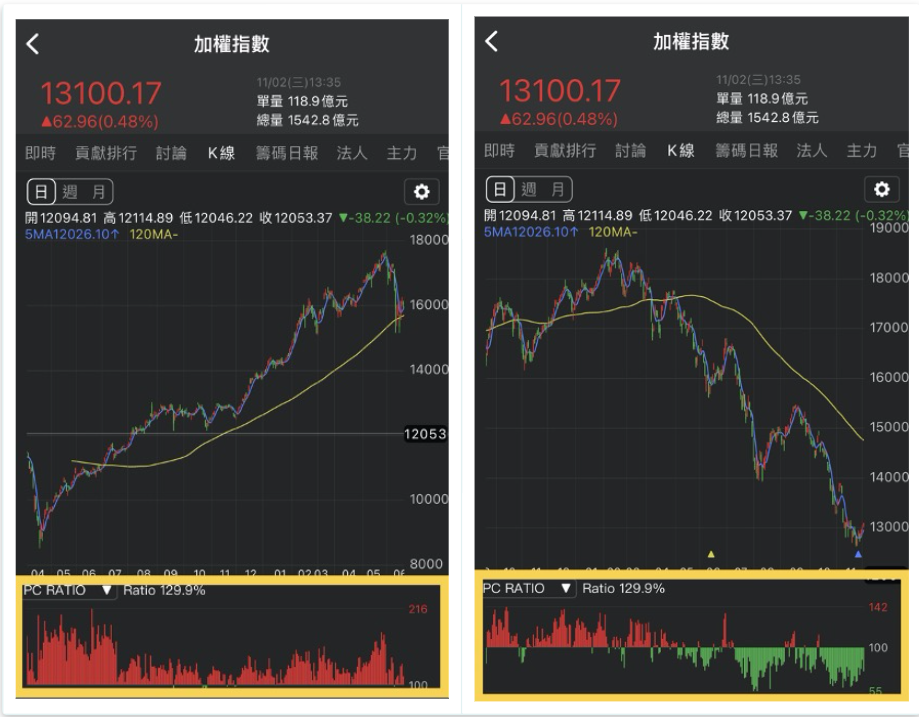
Observing the actual correlation between market indices and the P/C Ratio, one might notice that during bull markets, the P/C Ratio can surprisingly remain consistently above 1 (as illustrated notionally in “Figure 1” below). Conversely, during bear markets, the P/C Ratio (if expressed in a certain way, perhaps as a deviation from a mean, though the text says “negative numbers” which is unusual for a ratio unless transformed) might consistently be negative (as notionally illustrated in “Figure 2”).
“Figure 1” (as described in the text) would represent the stock market that relentlessly surged after the pandemic-induced crash a couple of years prior. During the rapid rebound from the lows, the P/C Ratio was actually at historically high levels. This indicated an unusually large proportion of bearish positions. However, the index continued to rally, indirectly confirming the significant power of a “short squeeze.” Conversely, during the subsequent year of decline, the P/C Ratio remained at historical lows, demonstrating the perils of “catching a falling knife” (buying into a steep decline).
However, if we shorten the time frame, it might appear that the P/C Ratio hitting its lowest point in a short-term range often precedes a rebound, and when it peaks, it might indeed coincide with an index high. This seems to contradict the conclusions mentioned earlier. Therefore, I believe that to effectively use the P/C Ratio, one must observe not only the numbers but also the prevailing trend, current market levels (e.g., support/resistance), and price-volume relationships.
Applying the Put/Call Ratio
So, how can we practically apply this? From a long-term investment perspective, if an investor primarily wants to be long, they would aim to buy at relatively low points. In this scenario, entering the market when the P/C Ratio is extremely high could be a strategy. Conversely, when the P/C Ratio is extremely low and the index has been at historical highs for an extended period, it might be prudent to consider reducing exposure. The image below (as described) shows the historical relationship between the S&P 500 Index and its P/C Ratio (the P/C Ratio in this chart is intentionally inverted, so when the inverted value hits a historical low and then reverses upwards, it could signal a bottom-fishing opportunity).
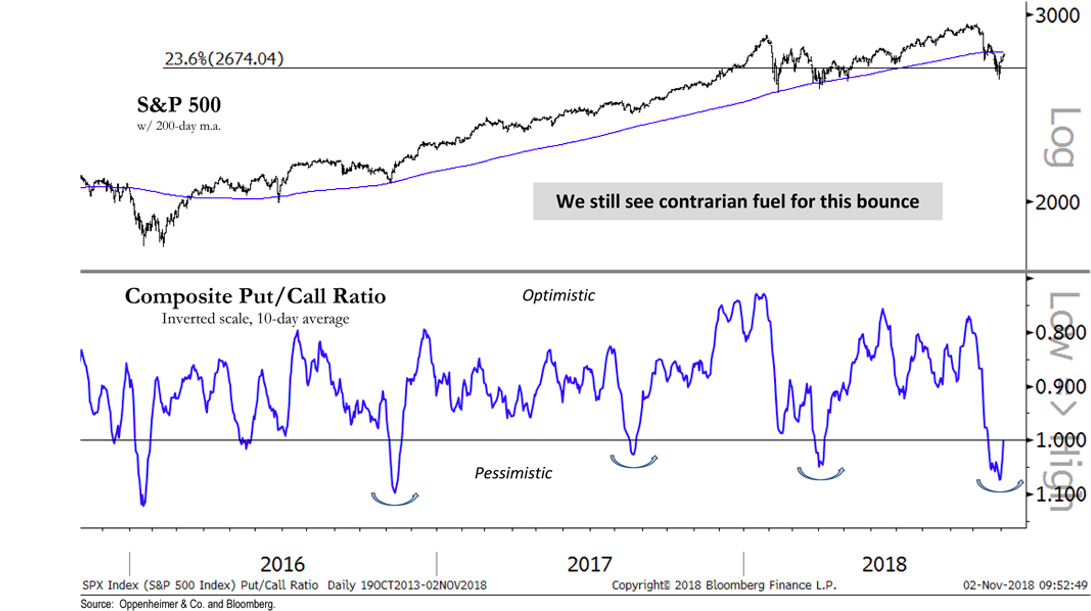 (Image source as cited in text: https://www.technicalanalyst.co.uk/ 2018 / 11 /put-call-firepower-for-sp/)
What about short-term speculators? When we observe the Open Interest P/C Ratio decreasing while the stock market has been continuously rising with increasing volume, it suggests that short-sellers have covered their positions (stop-losses triggered) and long-holders are starting to take profits. This could be a moment to look for shorting opportunities (as bullish momentum wanes due to profit-taking). One might try to identify resistance levels and enter short positions with a pre-defined stop-loss.
However, if volume also increases while open interest decreases during a short-term continuous decline, it might indicate that long-holders have liquidated their positions (stop-losses triggered) and short-sellers are beginning to take profits. This could be an opportunity to “play the rebound” and go long (as bearish momentum subsides due to profit-taking).
Therefore, regardless of a bullish or bearish trend, if trading volume and open interest show opposing trends, it might signal a potential market reversal, offering opportunities for short-term swing trades. If trading volume and open interest move in the same direction, it suggests the current trend is more likely to continue.